Protrading Assistance
See what leveraged speculators are actually positioned for — before you trade the pair.
Live CFTC Commitment of Traders positioning, 30 TradingView technical ratings, and our own candlestick & chart-pattern detection, all in one place. Free to register.
| XAU/USD | BUY XAU | High conviction |
| GBP/JPY | SELL GBP | Moderate conviction |
Strength Ranking
Ranked by a composite score: 60% net non‑commercial position (as % of open interest) + 40% week‑over‑week change in net position (as % of open interest). Positive = speculative crowd net long that currency; negative = net short.
Per‑Currency Snapshot
Pair Bias Matrix
| Pair | Bias | Conviction | Strength Gap | Net Pos (Base / Quote) |
|---|---|---|---|---|
| Loading pairs… | ||||
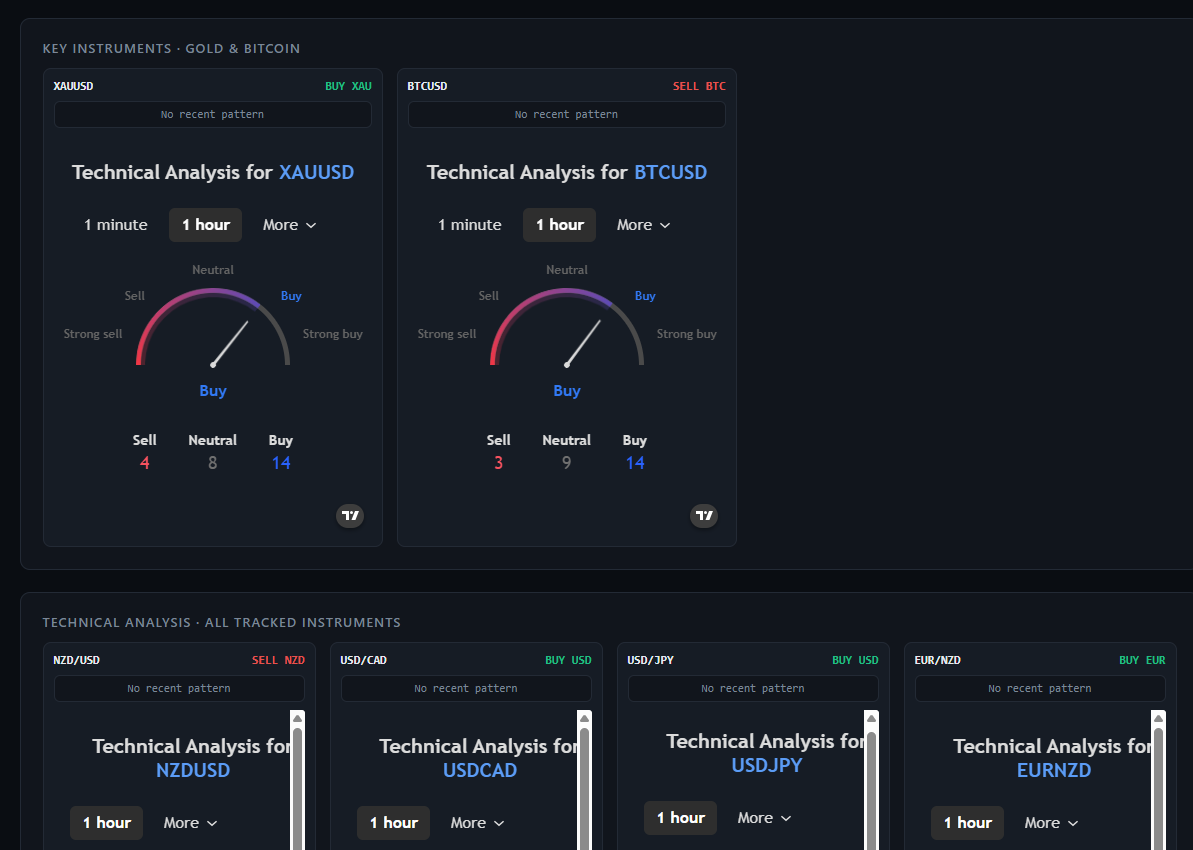
Key Instruments · Gold & Bitcoin
Three independent signals per card: the top badge is CFTC weekly positioning, the pattern badge is our own daily-bar scan, and the gauge is TradingView's own rating at whatever interval is selected above it. They won't always agree — different timeframes, different methods. Agreement across all three is a stronger signal than any one alone; disagreement usually just means lower conviction right now.
Technical Analysis · All Tracked Instruments
Same three independent signals as above, for all 28 pairs.
Trade Prediction · Technical Verdict
Independent of COT data. Each verdict comes from our own technical-rating engine — 10 moving averages (SMA/EMA at 10/20/50/100/200) plus 9 oscillators (RSI, Stochastic, CCI, ADX/DI, MACD, Momentum, Williams %R, Ultimate Oscillator, Bull/Bear Power), computed on a year of daily bars and combined into a single score. This is a transparent, from-scratch implementation of the same general methodology technical-rating gauges use — not a copy of any vendor's proprietary formula, and not investment advice. This will often disagree with the TradingView gauges on the Dashboard tab — those follow whatever short-term interval is selected there, while this table is a longer-horizon daily view. A pair showing "Strong Buy" here while its 1-hour gauge shows "Sell" usually just means a short-term pullback inside a longer uptrend, not a contradiction. In flat/choppy markets, moving averages can also cluster together and swing the verdict on very little real signal — check the Buy/Sell/Neutral vote breakdown before trusting an extreme reading.
| Pair | Verdict | Confidence | Score (Daily) | Votes (Buy / Sell / Neutral) |
|---|---|---|---|---|
| Loading predictions… | ||||